egoSlider: Visual Analysis of Egocentric Network Evolution
Yanhong Wu, Naveen Pitipornvivat, Jian Zhao, Sixiao Yang, Guowei Huang, and Huamin Qu
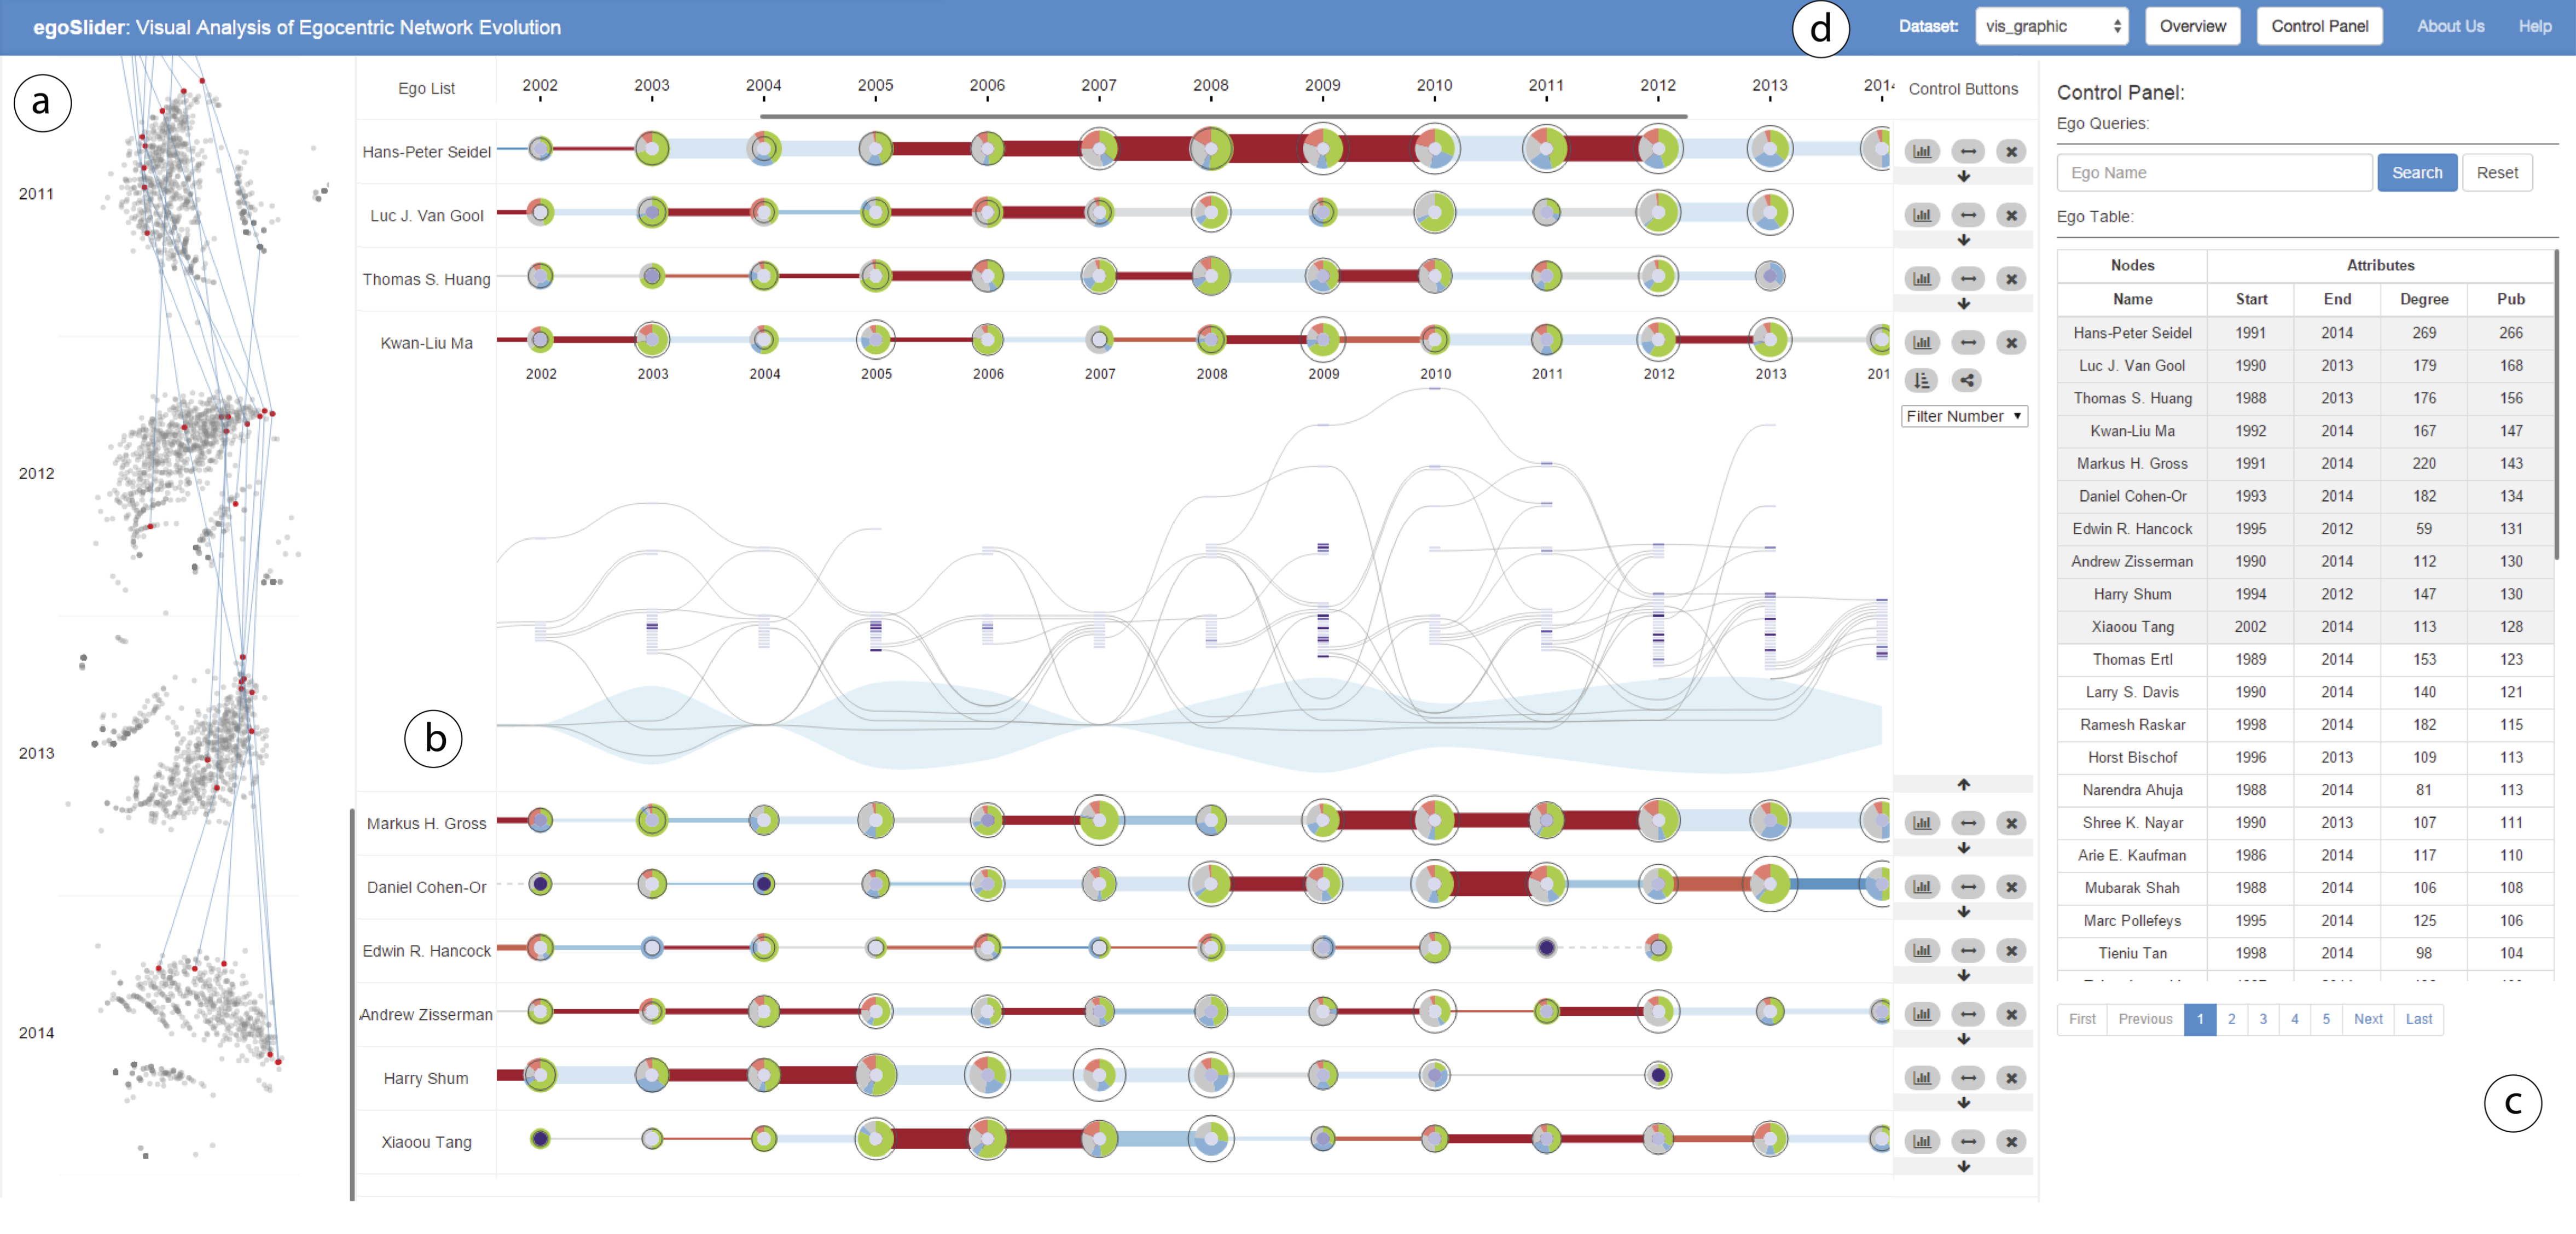
The egoSlider interface consists of the following components: a) a Data Overview showing patterns of the entire dynamic ego-network data, b) a main canvas displaying detailed ego-network evolutionary history of selected individuals, c) a control panel with a search bar and a data table, and d) a toolbar for selecting datasets. Currently, the main canvas shows the Summary Timeline Views of the top 10 researchers in a DBLP collaboration network dataset based on their publication numbers, where Kwan-Liu Ma’s timeline is expanded and shown in the Alter Timeline View.
Description
Ego-network, which represents relationships between a specific individual, i.e., the ego, and people connected to it, i.e., alters, is a critical target to study in social network analysis. Evolutionary patterns of ego-networks along time provide huge insights to many domains such as sociology, anthropology, and psychology. However, the analysis of dynamic ego-networks remains challenging due to its complicated time-varying graph structures, for example: alters come and leave, ties grow stronger and fade away, and alter communities merge and split. Most of the existing dynamic graph visualization techniques mainly focus on topological changes of the entire network, which is not adequate for egocentric analytical tasks. In this paper, we present egoSlider, a visual analysis system for exploring and comparing dynamic ego-networks. egoSlider provides a holistic picture of the data through multiple interactively coordinated views, revealing ego-network evolutionary patterns at three different layers: a macroscopic level for summarizing the entire ego-network data, a mesoscopic level for overviewing specific individuals’ ego-network evolutions, and a microscopic level for displaying detailed temporal information of egos and their alters. We demonstrate the effectiveness of egoSlider with a usage scenario with the DBLP publication records. Also, a controlled user study indicates that in general egoSlider outperforms a baseline visualization of dynamic networks for completing egocentric analytical tasks.
Materials
Videos
About
VisNexus is a series of visualization projects aiming to improve our understanding of the complex relations among data entities, which is conducted by the VisLab at Hong Kong University of Science and Technology. The HKUST VisLab is a multidisciplinary group aiming at improving the visual analysis and various visualizations.
Topics
The projects are categorized into following five topics:
Contact
Yanhong Wu: yanhong.wu@ust.hk
Yong Wang: ywangct@ust.hk
Qiaomu Shen: shenqiaomu@ust.hk
Address: Department of Computer Science and Engineering, Hong Kong University of Science and Technology, Clear Water Bay, Kowloon, Hong Kong