Publications
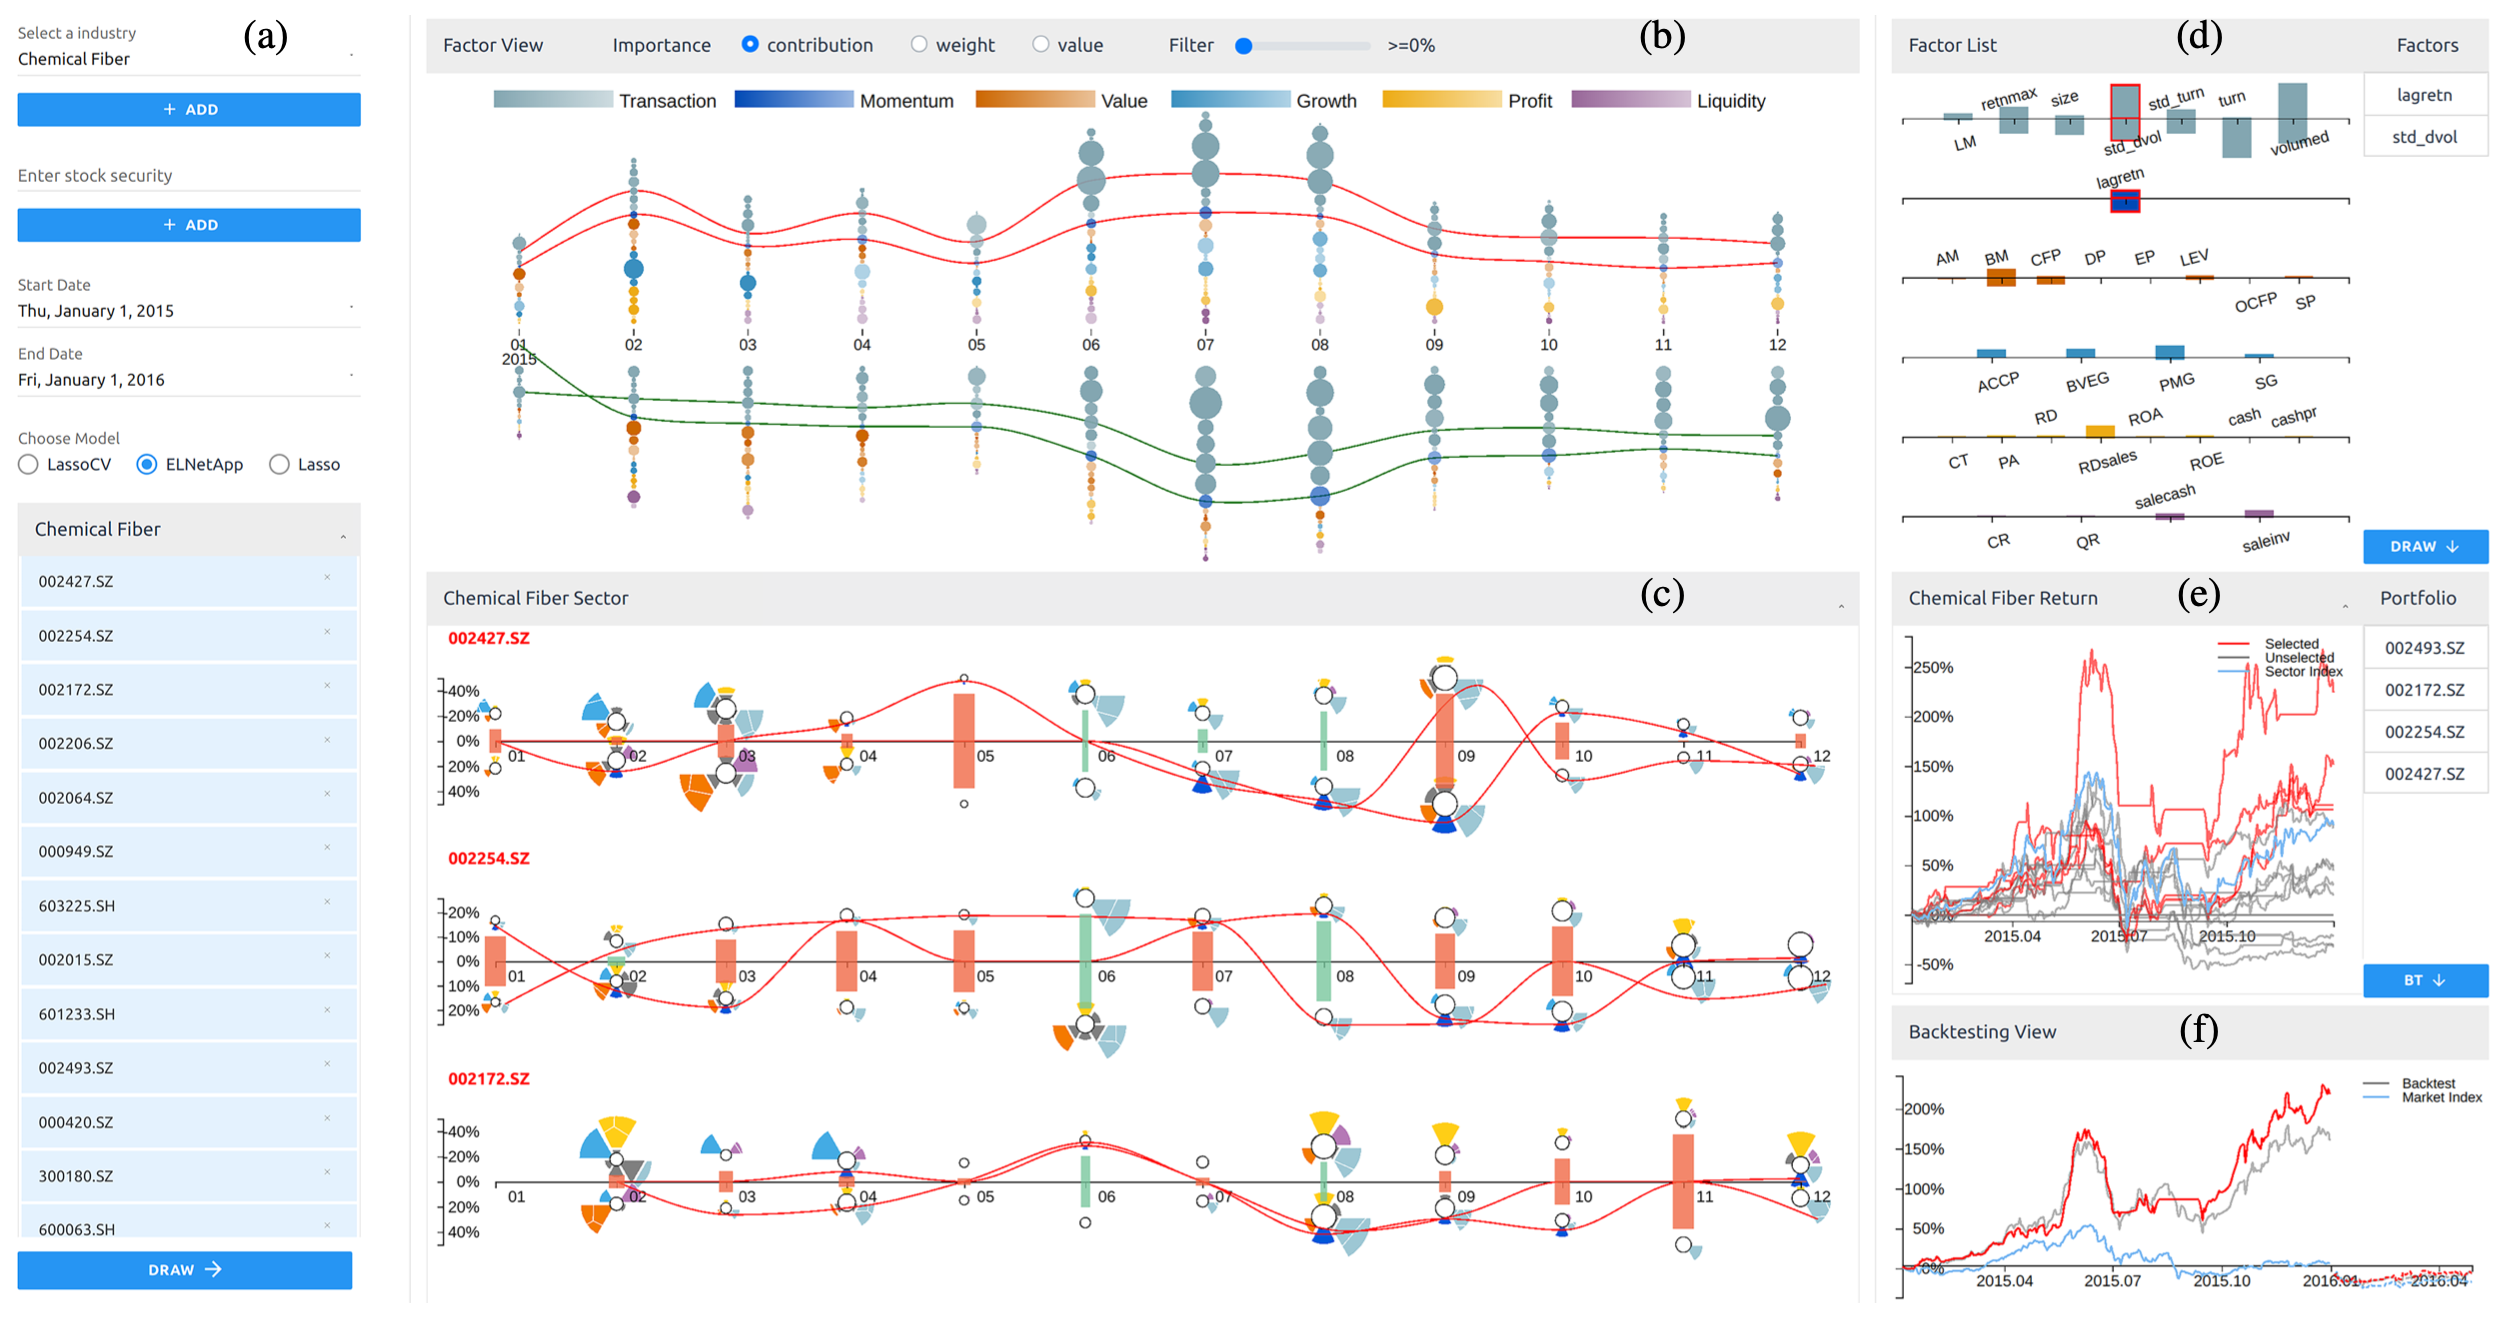
iQUANT: Interactive Quantitative Investment Using Sparse Regression Factors
To appear
Author: Xuanwu Yue, Qiao Gu, Deyun Wang, Huamin Qu, and Yong Wang
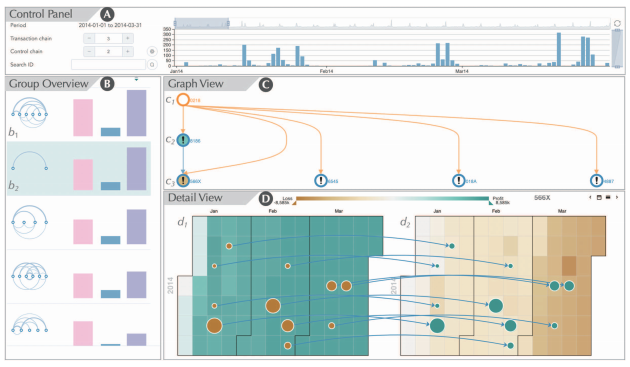
TaxThemis: Interactive Mining and Exploration of Suspicious Tax Evasion Groups
IEEE Transactions on Visualization & Computer Graphics, 2020
Author: Yating Lin*, Kamkwai Wong*, Yong Wang, Rong Zhang, Bo Dong, Huamin Qu, and Qinghua Zheng
[ abstract ] [ url ] [ preprint ]
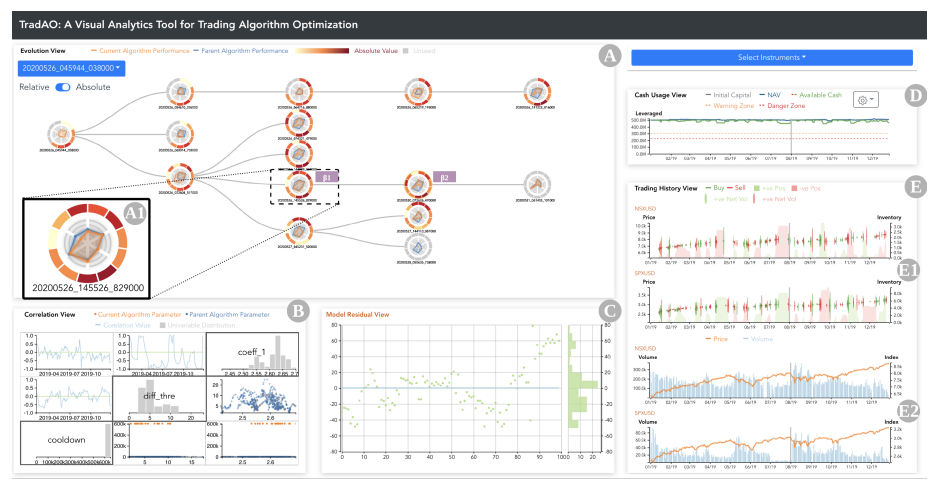
TradAO: A Visual Analytics System for Trading Algorithm Optimization
IEEE Visualization Conference (VIS), 2020
Author: Ka Wing Tsang, Haotian Li, Fuk Ming Lam, Yifan Mu, Yong Wang, and Huamin Qu
[ abstract ] [ url ] [ preprint ]

sPortfolio: Stratified Visual Analysis of Stock Portfolios
IEEE Transactions on Visualization & Computer Graphics, 2019
Author: Xuanwu Yue, Jiaxin Bai, Qinhan Liu, Yiyang Tang, Abishek Puri, Ke Li, and Huamin Qu
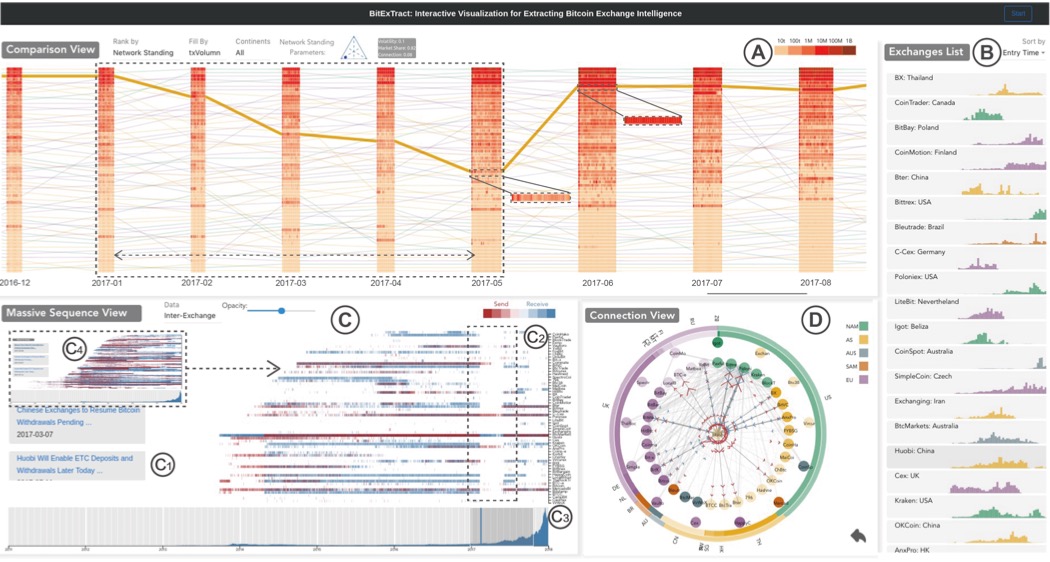
BitExTract: Interactive Visualization for Extracting Bitcoin Exchange Intelligence
IEEE Transactions on Visualization & Computer Graphics, 2018
Author: Xuanwu Yue, Xinhuan Shu, Xinyu Zhu, Xinnan Du, Zheqing Yu, Dimitrios Papadopoulos, and Siyuan Liu

Towards Easy Comparison of Local Businesses Using Online Reviews
Computer Graphics Forum, 2018
Author: Yong WANG, Hammad HALEEM, Conglei SHI, Yanhong WU, Xun ZHAO, Siwei FU, and Huamin QU
A Survey on Visual Analysis of Financial Data
Author: Xuanwu Yue
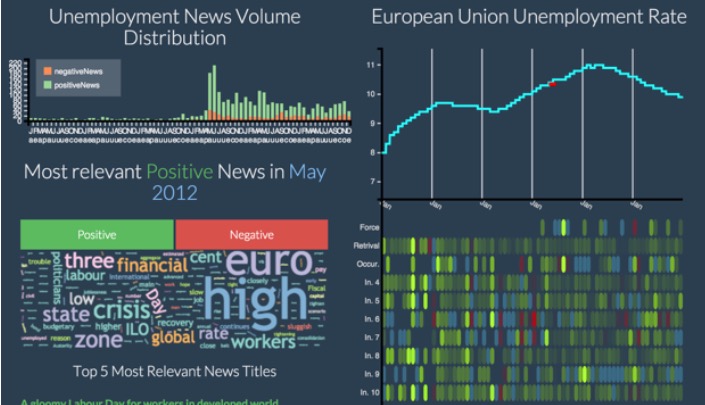
FinaVistory: Using Narrative Visualization to Explain Social and Economic Relationships in Financial News
International Conference on Big Data and Smart Computing (BigComp), 2016
Author: Yeuk-Yin CHAN and Huamin QU
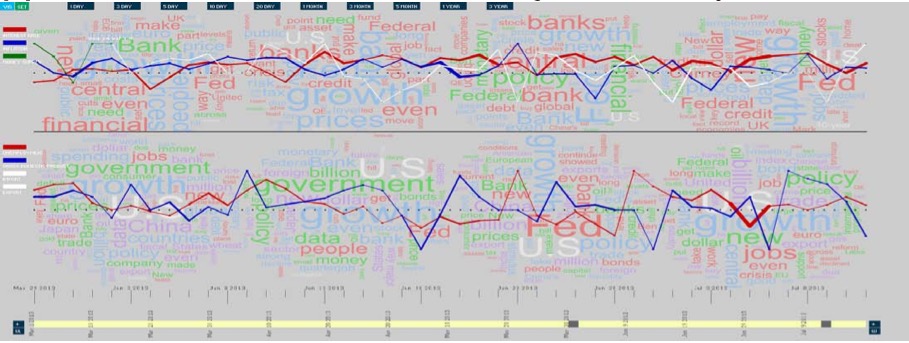
TrendFocus: Visualization of trends in financial news with indicator sets
International Conference on Big Data and Smart Computing (BigComp), 2014
Author: Yik-Wai NG and Huamin Qu